Mapping Salesforce property data into priceless 3D opportunities
SHB Giga
Real Insight, Real People, Real Results
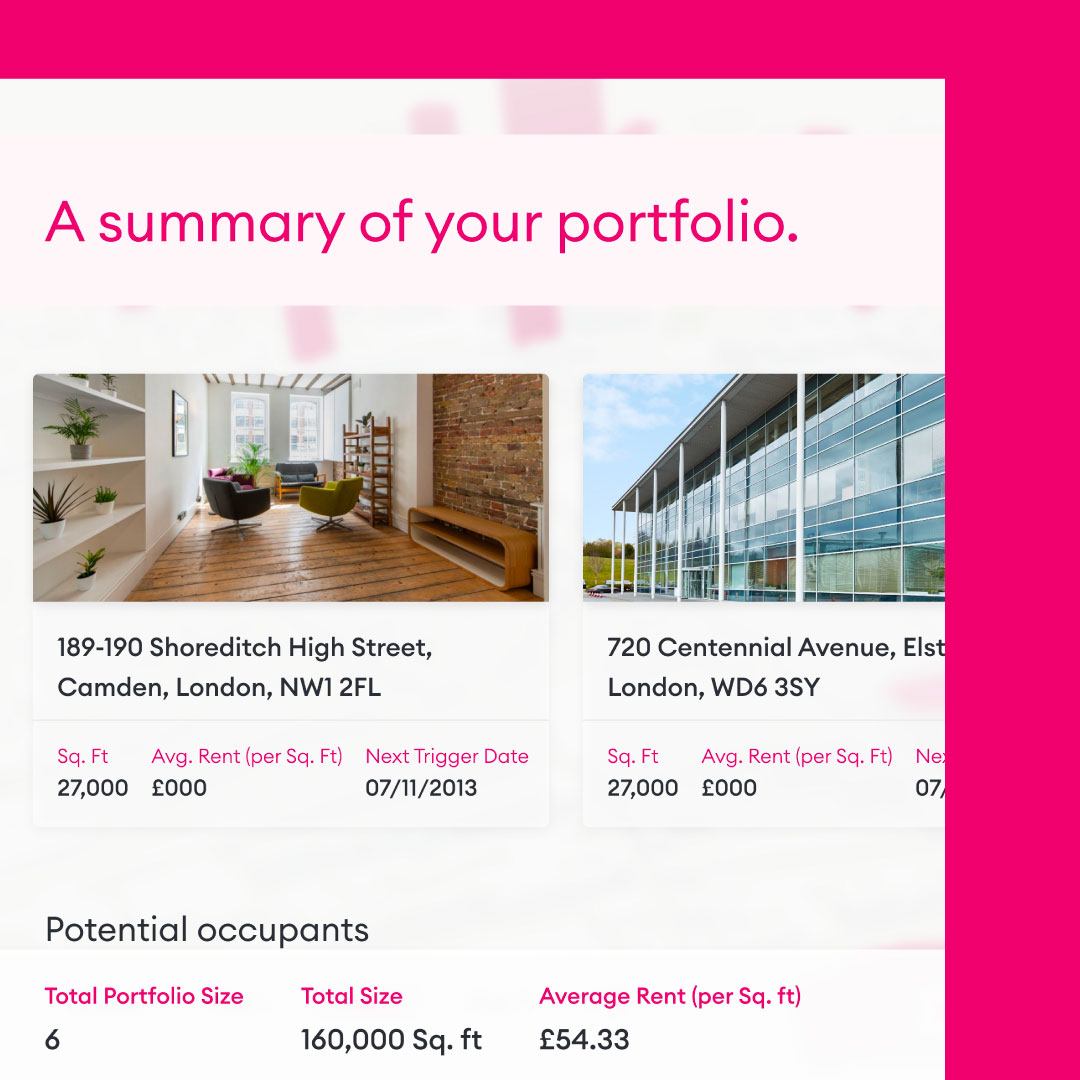
SHB unites years of commercial property experience with tech to help their users make intelligent decisions. By drawing on their accumulated data and insight from a mix of bespoke databases and real world experiences from expert teams, SHB is able to work fiercely to provide vital information and secure the best deals for their clients – all founded on a bedrock of real business intelligence.
To continue to deliver on these priorities, a new technical solution was required – one that would combine deeply engaging creativity with data presentation and visualisation to create insights and unique advantages for users looking at commercial property. To stand out in the commercial property sector, this solution would have to put user experience first whilst also delivering complex information, utilising the unique insights of the SHB team to drive value.
The Birth of Giga
Working with SHB, Wonderful brought together creative visual mediums with deep data including history and the commercial story behind buildings into a new system called Giga – making information more accessible, and allowing for more intelligent decision making all with a brand new experience that would provide users with surprising, delighting moments, generating long term engagement.
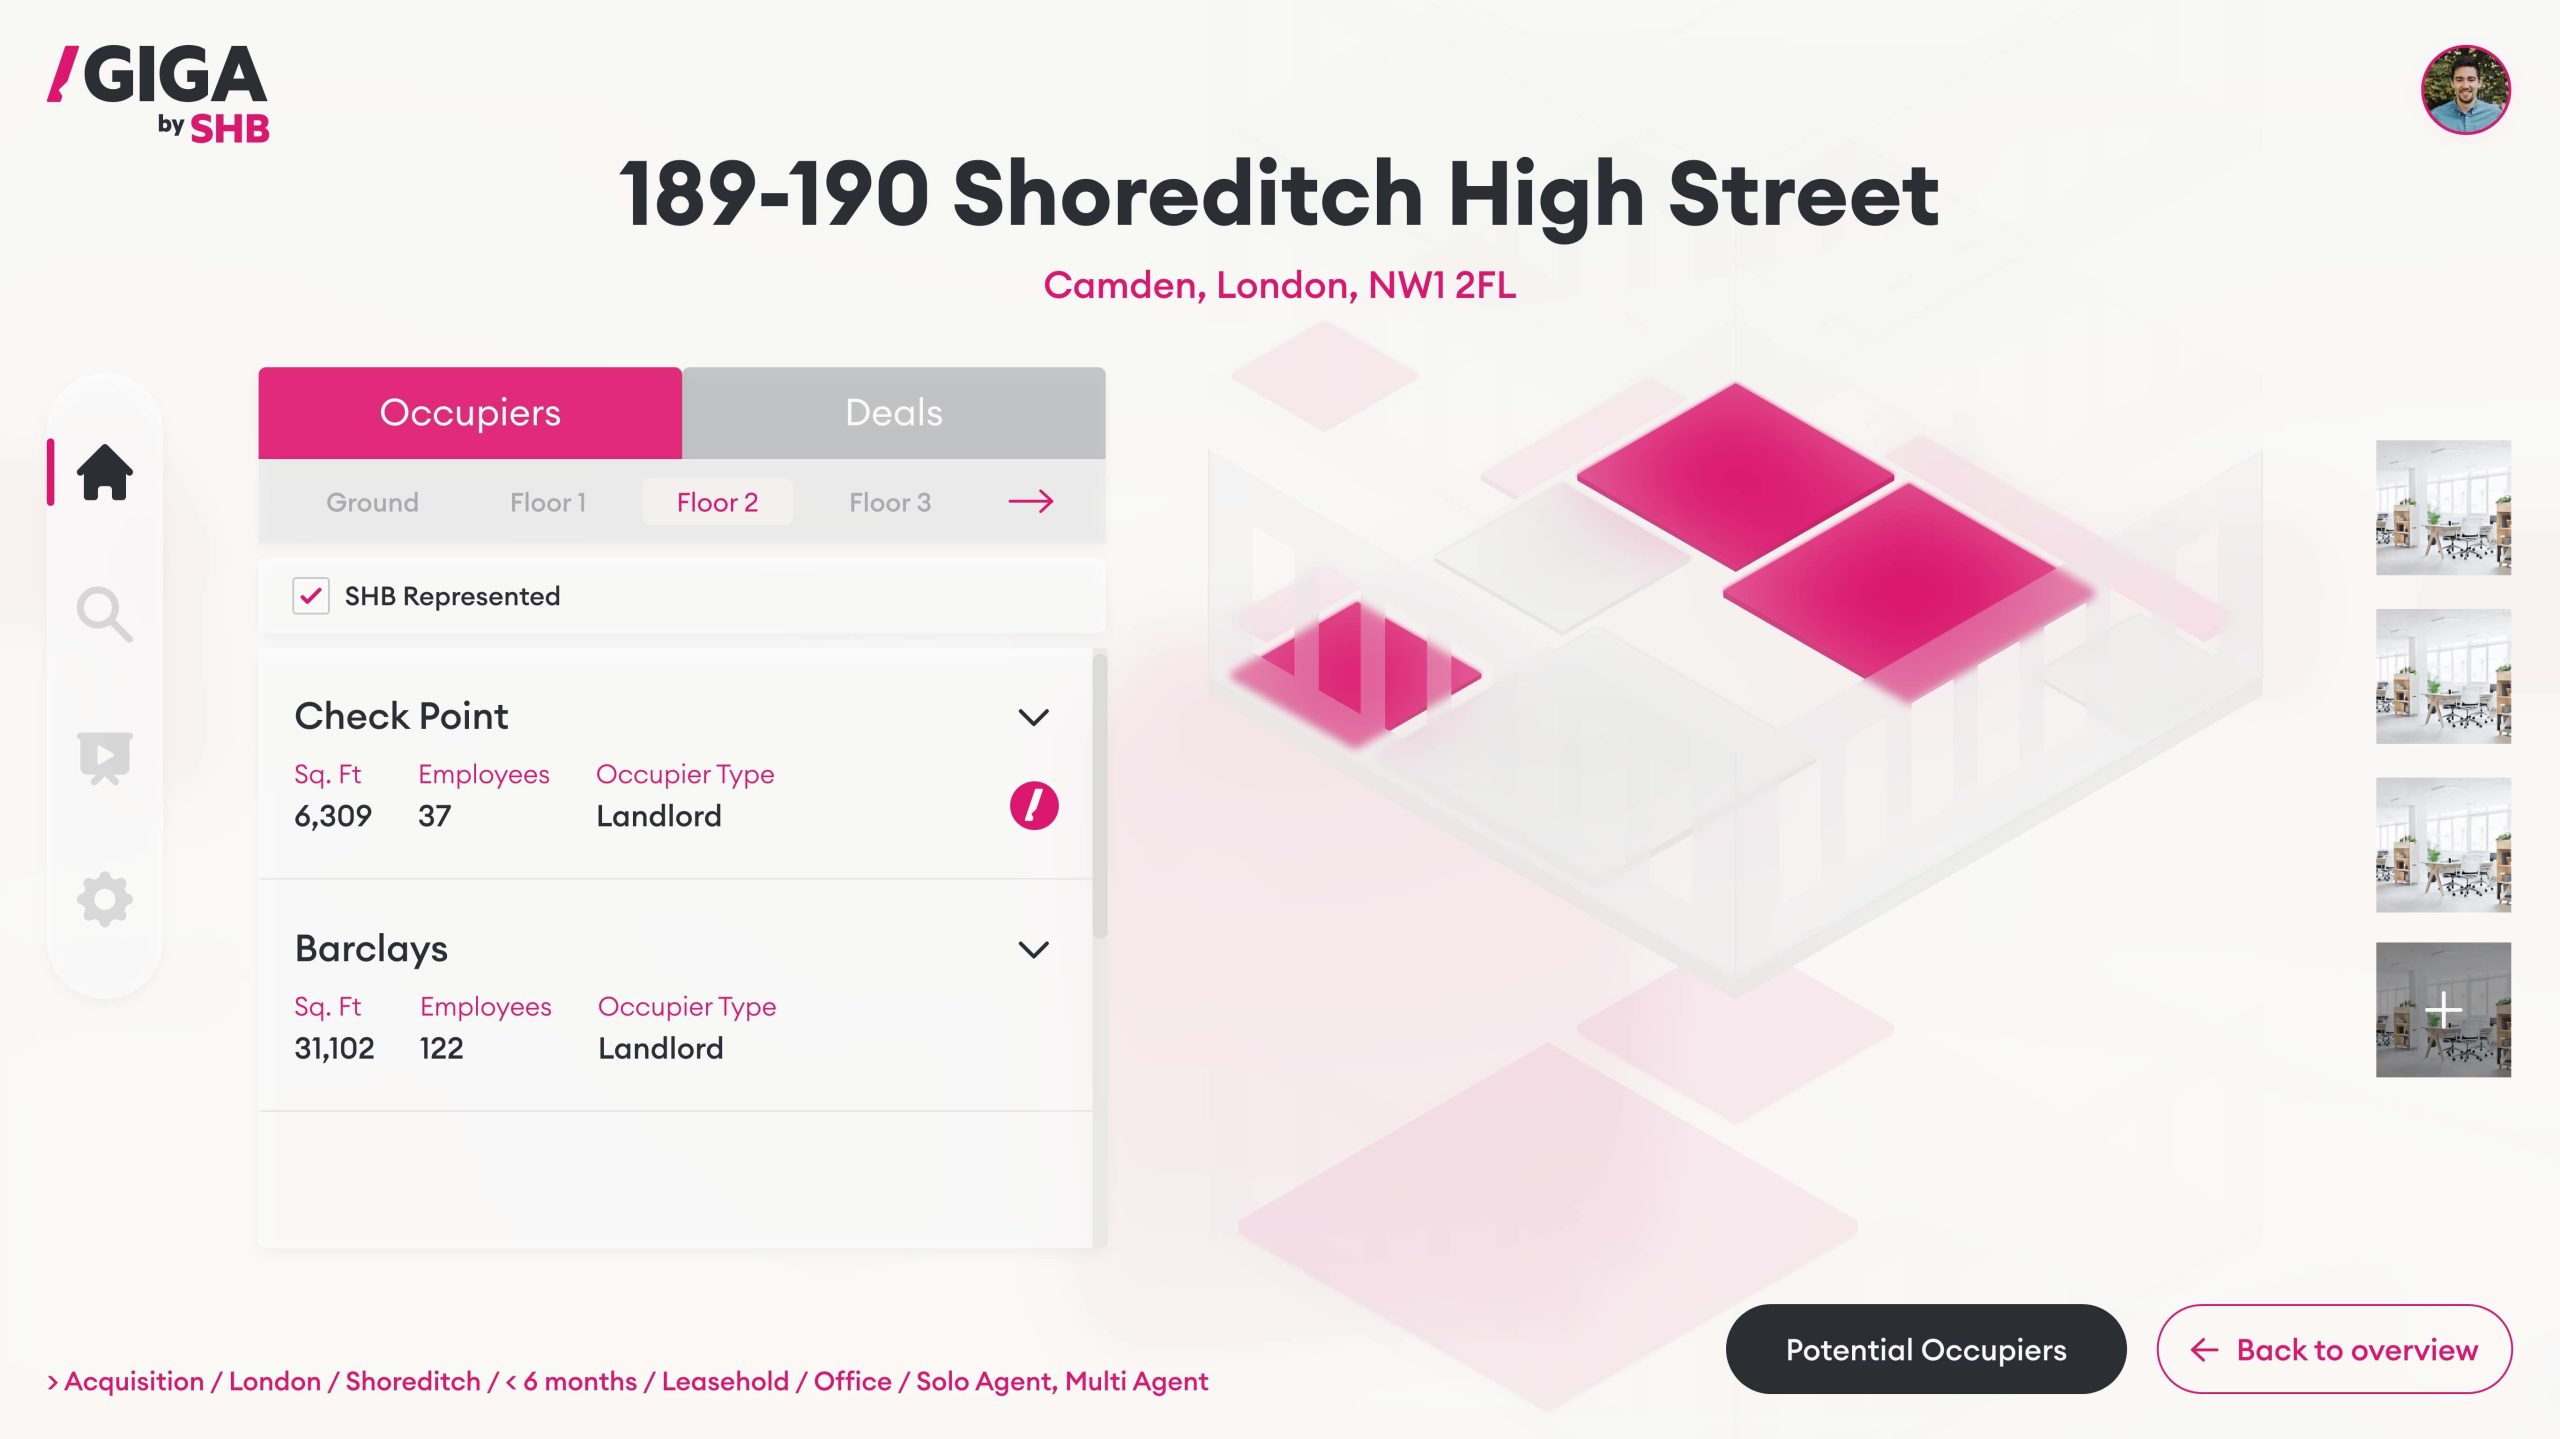
The SHB Giga system is, fundamentally, a data visualisation tool, delivering buildings and tenant data via a hybrid app; Laravel powering API requests, system authentication and database interactions with Vue being used to trigger the fetching of data, visualising received data and handling the majority of the UI.
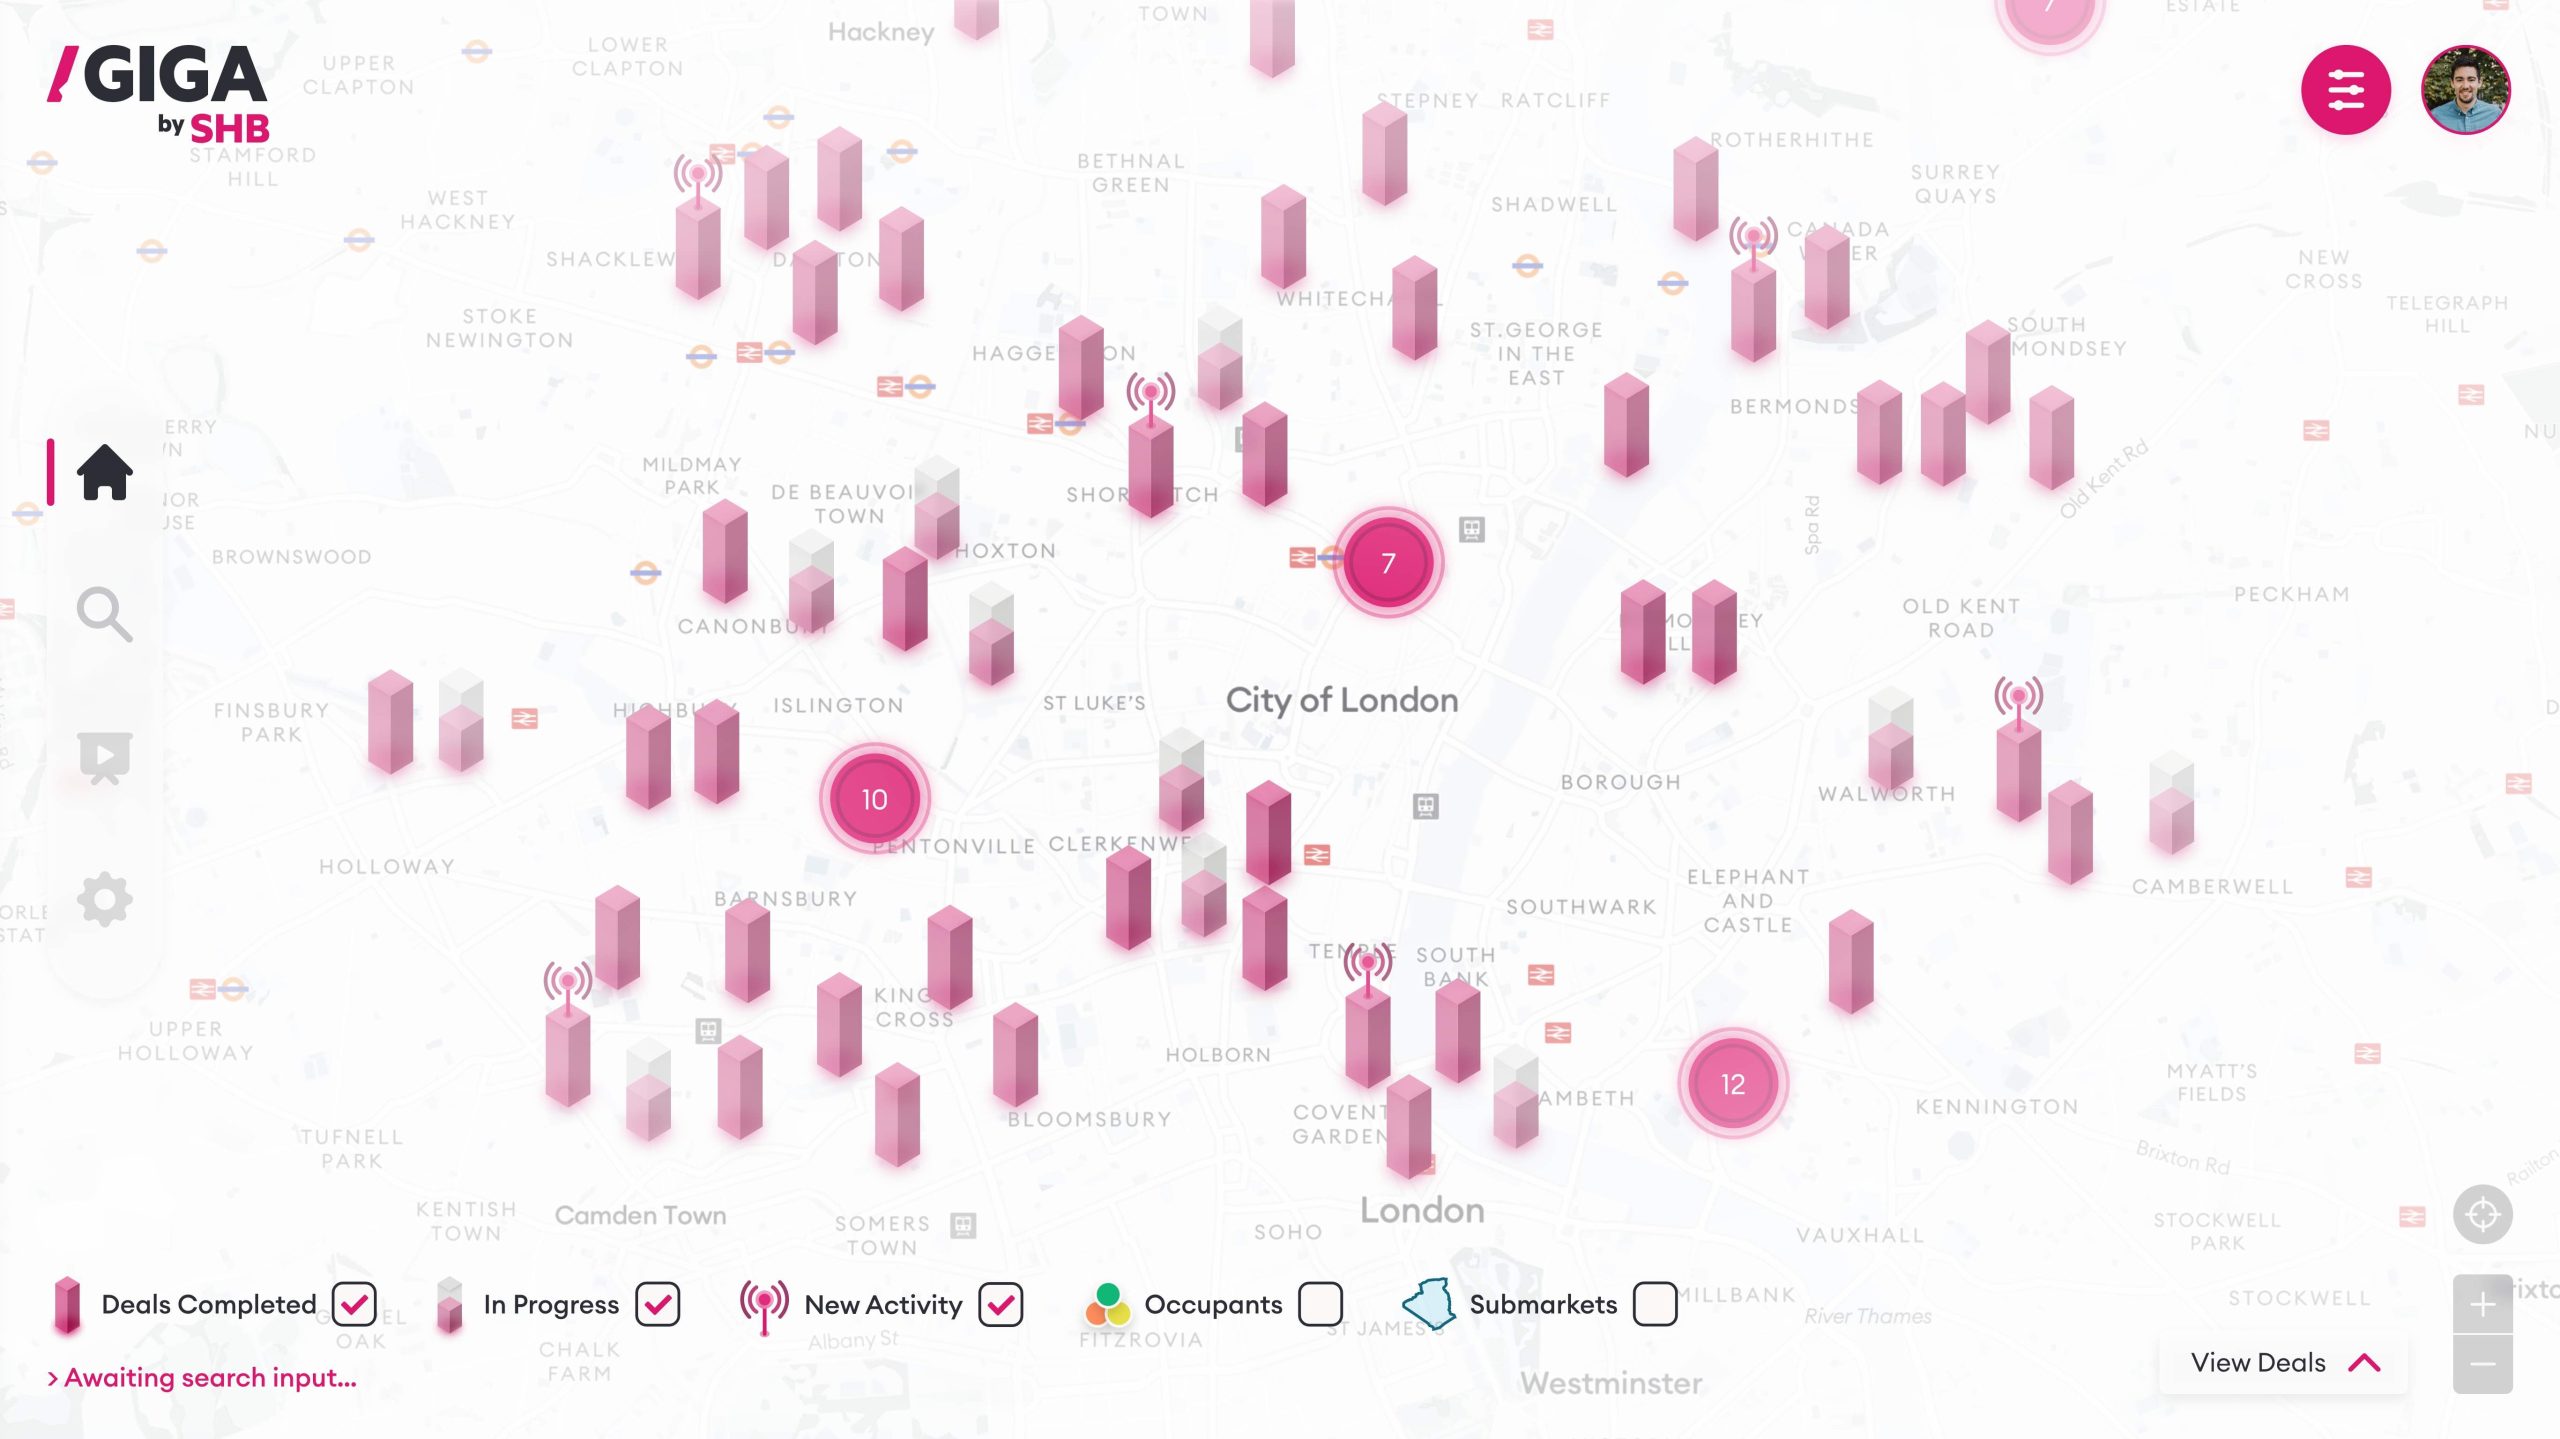
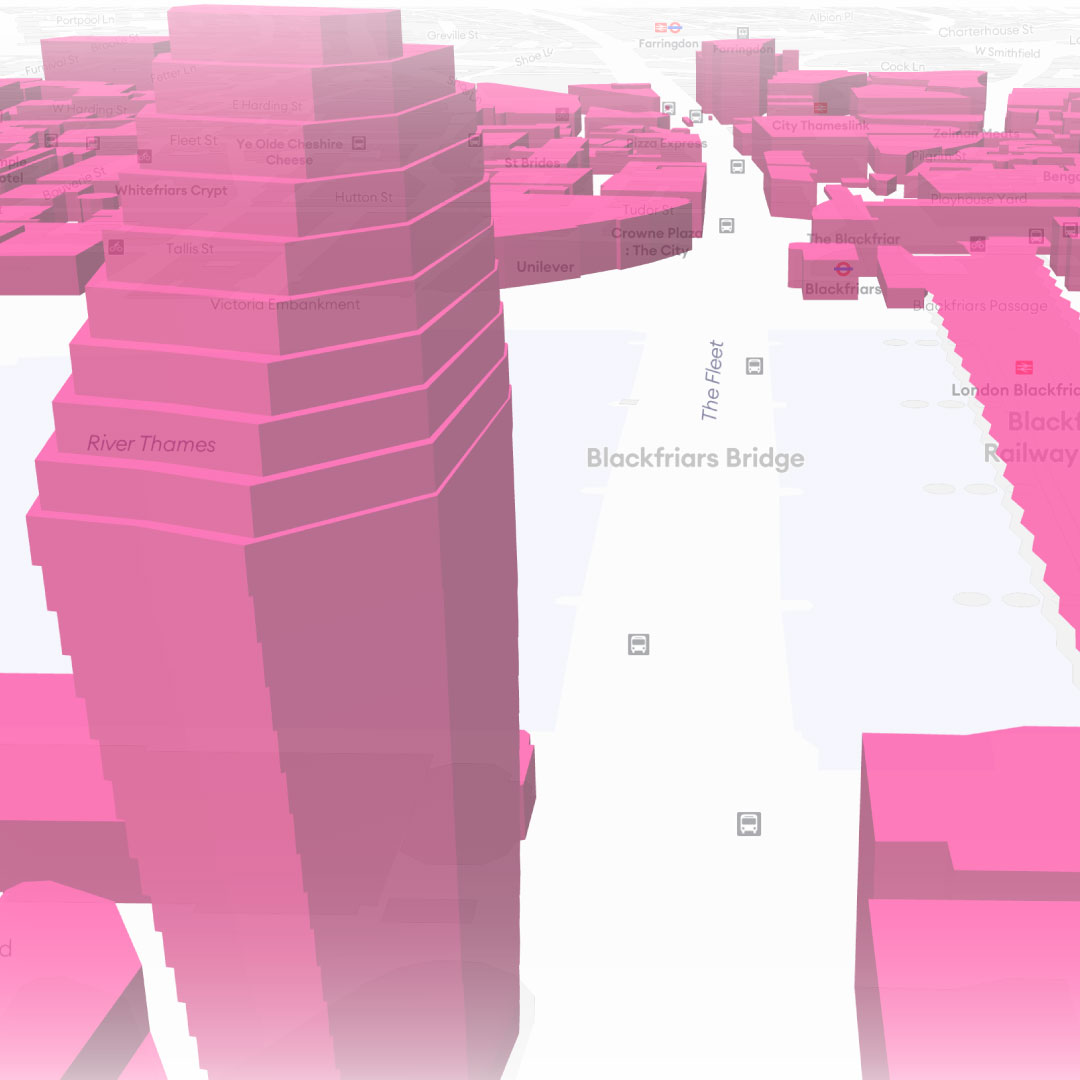
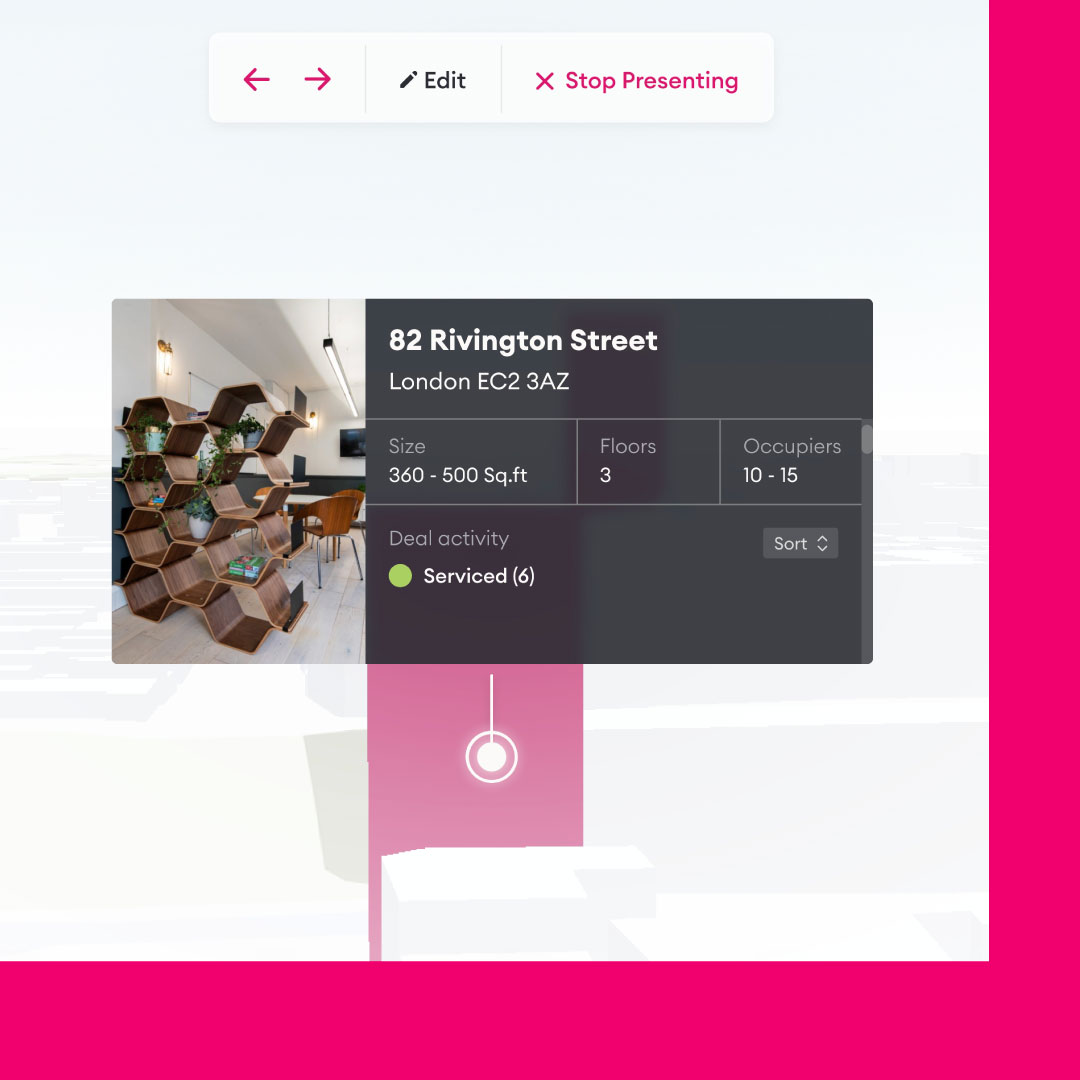
To bring these processes to life, and ensure that Giga would capture users, a custom 3D map was created to present data, combining the SHB brand with an interactive media display that serves to further highlight the quality and depth of information whilst also being a significant factor in creating wonder for users.
The system currently has 207 building data points that are active, with 2511 additional records for floor data, tenant data and lease data attributed to those buildings – more records are added each day. Data is regularly updated and cached, ensuring that user experiences are quick and consistent while they browse the interactive map, and making each use a fresh experience.
-
01
3D interactive map
-
02
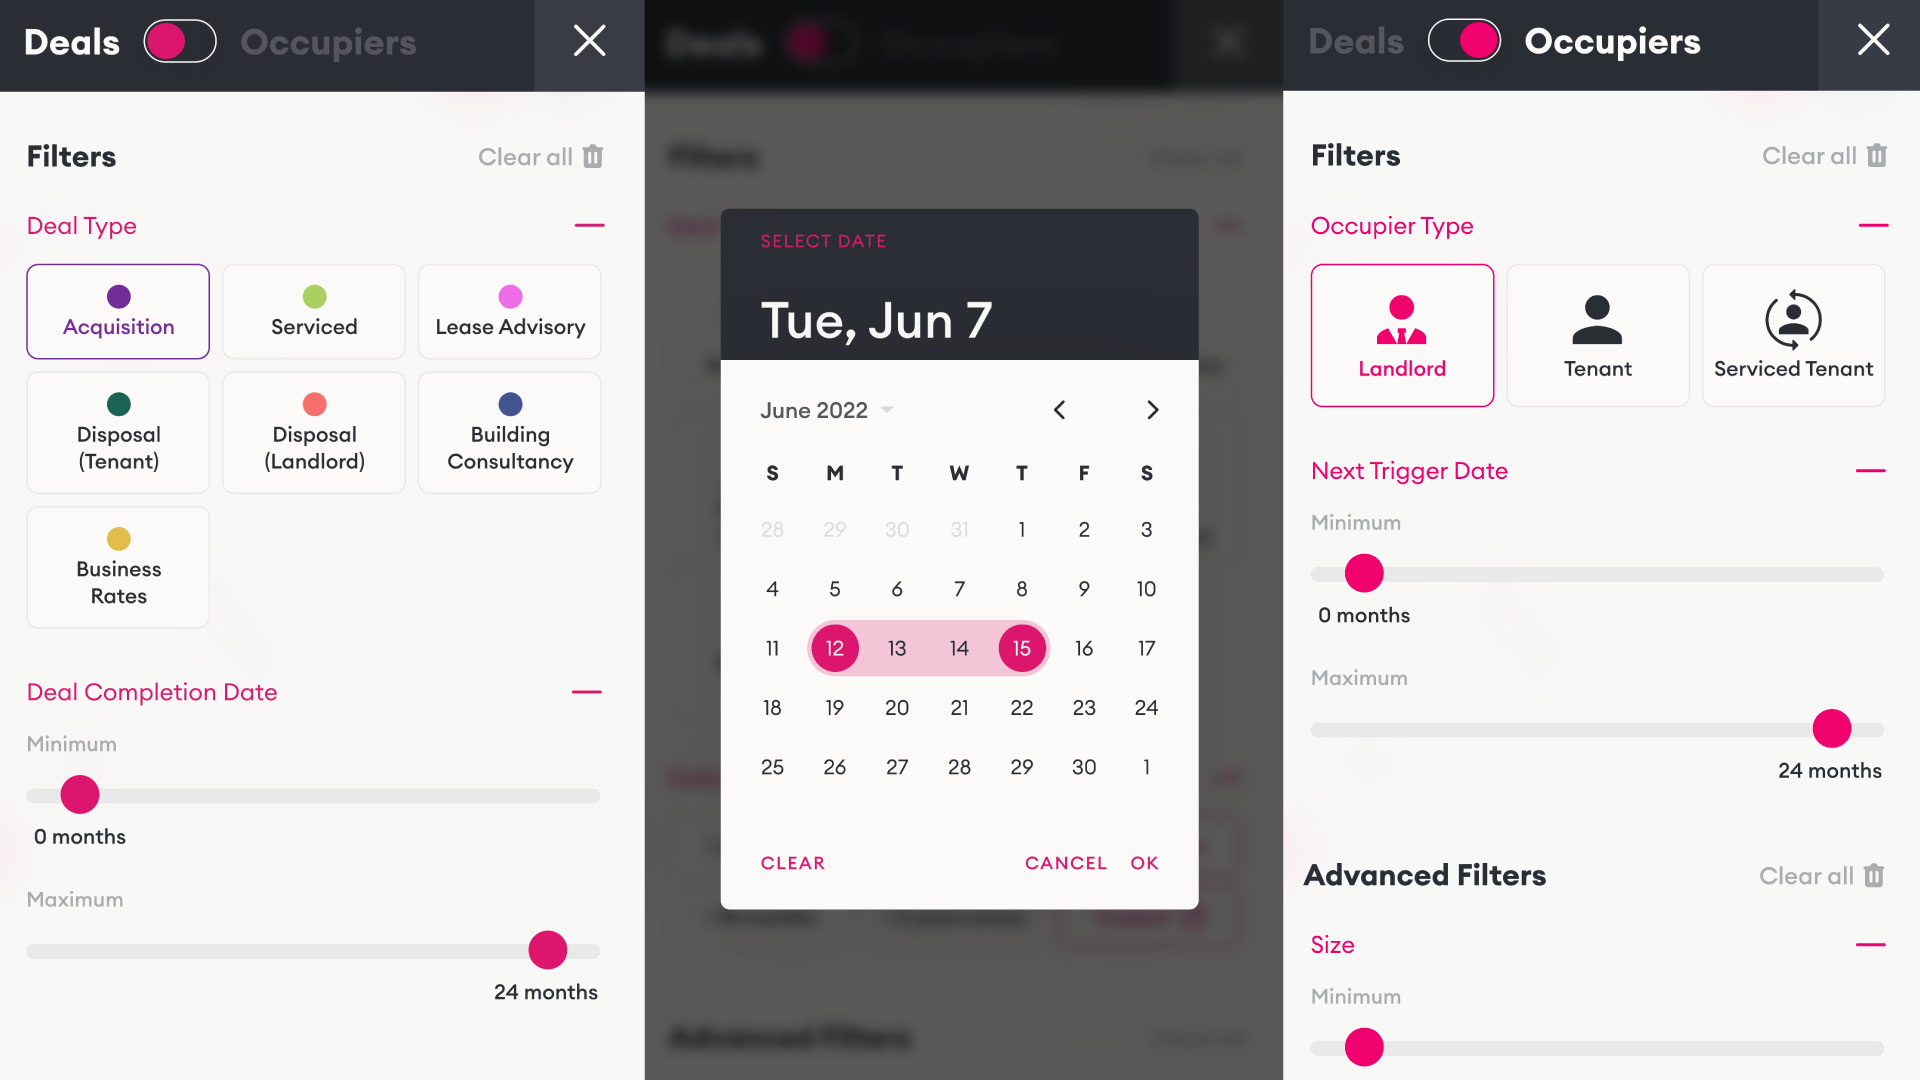
Data visualised to reveal opportunities
-
03
Sales Force integration
-
04
Sales presentation builder
-
05
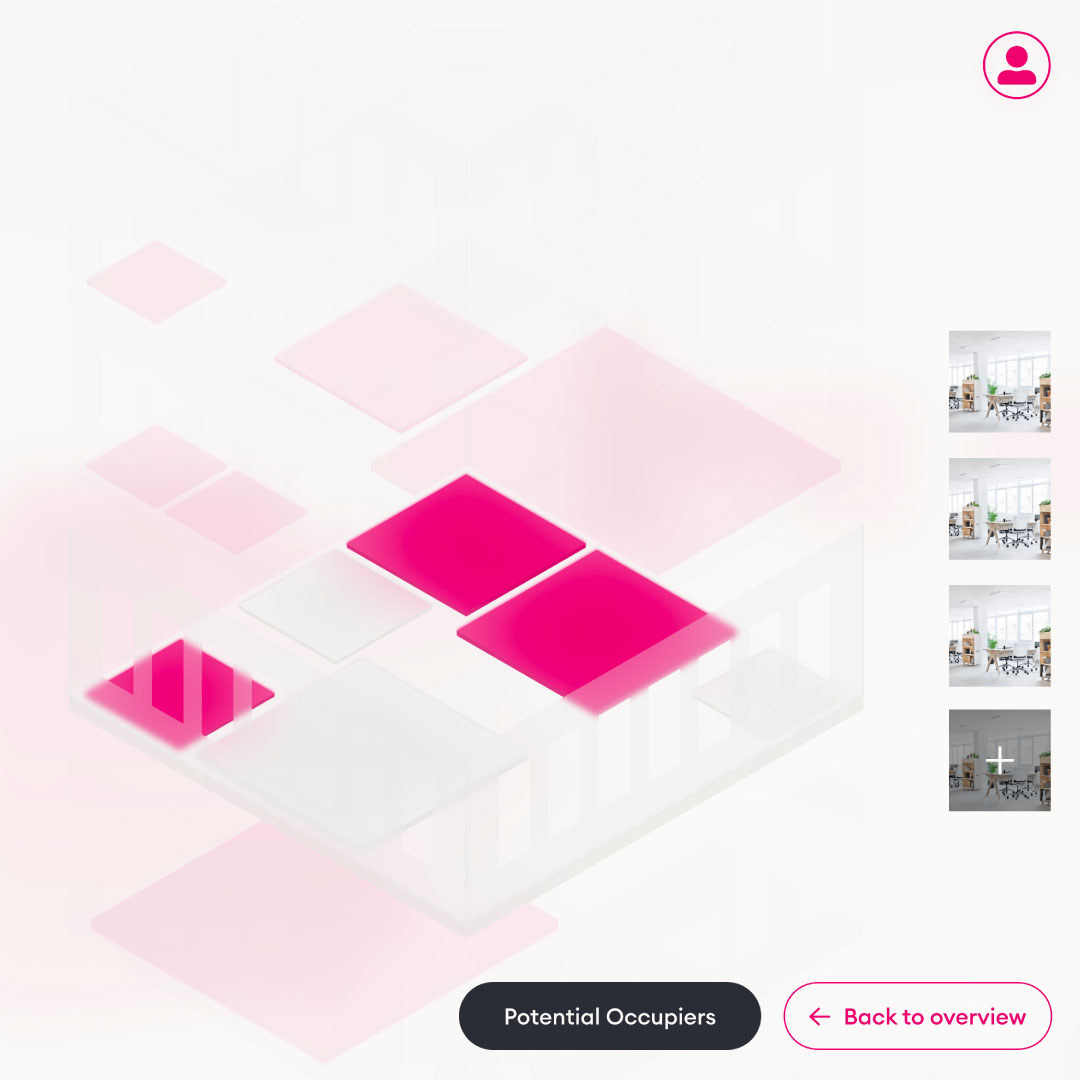
207 building exploded views
-
06
2500+ commercial building insights
