Businesses large and small are now claiming to have data-driven digital-first strategies, but choosing which metrics really matter to your business, and which are indicators of business success can actually lead to red-herrings, dead ends and poor strategic decision making.
Thanks to the evolution & adoption of digital channels, the sheer reach of brand message has never been larger; nor has marketing success ever been so measurable, or with such unfathomable granularity. So, which metrics can help simplify the complexity of digital marketing, and truly give a measure of success?
In truth, the answer is: It depends.
It would be remiss of us to define a universal set of metrics for every business. However, we’ll use a real-world scenario to explore some of the key measurements a business tracks as standard and how they may or may not be a valid indicator of success.

Not all traffic is created equal:
The obvious digital metric most clients tend to measure is Traffic (who remembers those site counter gifs all websites used to have in the footer back in the early 2000s?). The assumptive logic here is that the more people you get to your website, the better. Whilst this is certainly a consideration, in truth it’s really the quality of this traffic which needs to be measured and there’s a plethora of sub-metrics which can indicate quality of traffic.
A great example of this from our own experience is when a very well known car manufacturer positively reported a huge increase in traffic MoM (month on month). “Great, the campaigns are working!” was the initial internal feedback.
However, this increase in traffic actually negatively affected one of the brand’s key KPIs, decimating their conversion rate (a KPI which we were being measured against). As any marketer will understand, be it agency-side or client-side, this led to all manner of frustrated email communications and urgent business-critical meetings.
It was when we explored the ‘why’ and the deeper metrics behind the headlines that it all unravelled. Marrying the traffic and conversion rate data with other metrics became vital: during exploration, we discovered that the website’s bounce rate had increased uncharacteristically (and with no seasonal impact or economic pressures); new vs returning users had swung massively towards new users; and average session duration had decreased massively. This indicated that a large volume of poor quality traffic was being driven to the site (the old adage of quality over quantity rang true).
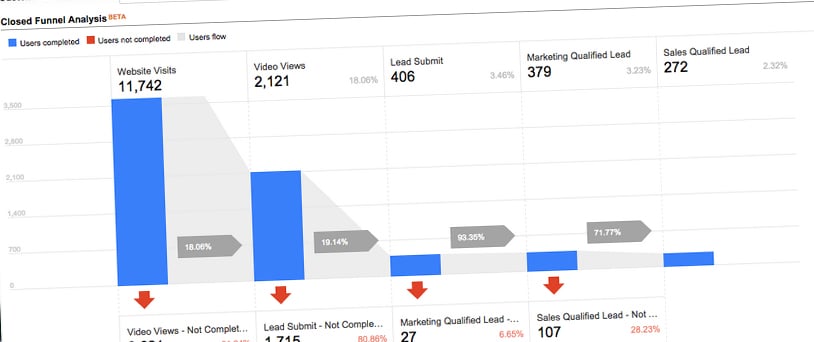
Further investigation into the sources of the non-converting traffic uncovered that our client had employed another third party agency to run a high-budget display advertising campaign across the Google Display Network (often called GDN). Whilst driving huge vanity metrics (impressions) and clicks/traffic to the site, the conversion rate was being dragged down as the quality of these users was just not right. It just wasn’t the right fit for them if conversion rate was their KPI metric, or the progress would need to be monitored over a much longer term to see the actual effect (heightened brand awareness, trust/authority built, increase in buying intent over time, returning usage, conversion rate improvements in the long term, and so forth).
Vanity vs Actionable metrics:
A mantra all digital marketers should have in their repertoire is: “Vanity Metrics for Show. Actionable Metrics for Go.” By definition, Vanity Metrics are those which you can measure, but which don’t really matter. They can be easily changed or manipulated, and they often do not bear any relevance or direct correlation with numbers that actually indicate business success.
Examples include impressions, likes, followers and in some examples the aforementioned traffic. These numbers can be huge (relative to harder-to-attain, actionable measures) and the allure of vanity metrics soon fades when you are looking to demonstrate ROI.

However, it’s important to truly consider whether or not a statistic like “social follower numbers” or “impressions” are always a vanity metric. If they facilitate actionable decision making, they are still able to make a valuable contribution to your sales funnel and help steer your strategy.
As long as those impressions are leading to clicks, clicks to actions, actions to sales (in ever-improving ratios), nurturing users down the funnel, then they still contribute to the goal; they should just not be used as a measuring stick of success. One recommendation is to try asking three questions of the metric to decide if it is truly valuable or not:
- Does this allow us to make a business decision? (I.e. can we use this data to inform a course of action?)
- Can we influence replication of this result? (I.e. are you in control of cause/effect?)
- Is this a valid reflection of the truth? (I.e. could you potentially just spend more money to generate increased numbers in that metric? For example, ppc follower-acquisition campaign or increased budget on a display campaign).

Where do I measure these metrics once defined?
The challenge marketers actually face (once they’ve deciphered which metrics fulfil a valuable contribution to the measurement of success), is finding where this data lives and, more importantly, finding it in a simple enough format to make sense of it and to enable actionable decision making.
At any one time, these metrics could live in 10s of places (with varying accuracy depending on your technical set up): Google Analytics, Google Ads, Google Search Console, Facebook Insights, Twitter Analytics, LinkedIn Ads, MailChimp, HubSpot, SalesForce, eCommerce Platforms, the list goes on.
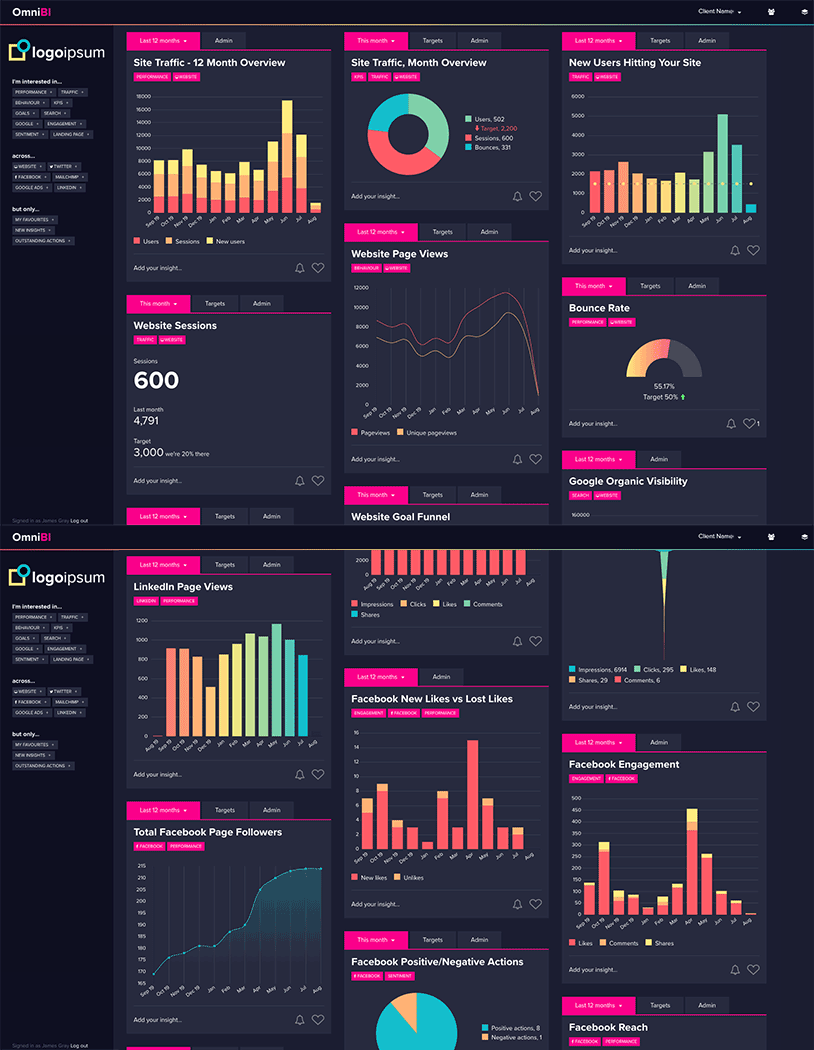
There are a range of tools of varying scale which can serve this purpose, but with simplicity often of the essence, they can also be rather overwhelming. This is why Wonderful developed a unique proprietary tool, OmniBI, to beautifully aggregate, analyse and present this multi-source data in a meaningful and valuable way, adding vital insight, empowering all parties to deliver growth through data-driven decision making.

Since using OmniBI with our clients we have been able to measure the metrics that matter, demonstrate genuinely valuable insights and help steer our client’s strategies with real, data-driven decisions. It has become the internal reporting tool of choice for a number of our clients, enabling teams to see the metrics they need at a glance, celebrating the wins and learning from the challenges, whilst validating their budgetary spend and strategy in real time. To see more, watch the video:
To explore the complex metrics which may matter to your business and to make them wonderfully simple, and to find out more about how we utilise OmniBI to report on the defined KPIs once true value has been defined, feel free to get in touch with us.
Latest posts

5 reasons why we still need Wonder in an AI driven world
As an agency, we are grappling with the role and application of AI within our daily business activities, our client offering, and our future growth

The Power of Purpose and Impact on Business Growth
In a marketplace increasingly driven by values and social consciousness, the role of purpose and impact in business growth has never been more critical.

Three key benefits of integrating a sense of Wonder within your brand & marketing strategies
We love creating Wonder. It’s our passion and forms our client mission. However, in an age where your customers and clients are bombarded with constant information and countless choices, capturing attention and building lasting connections has become increasingly challenging. We all have to work harder to capture people’s attention.